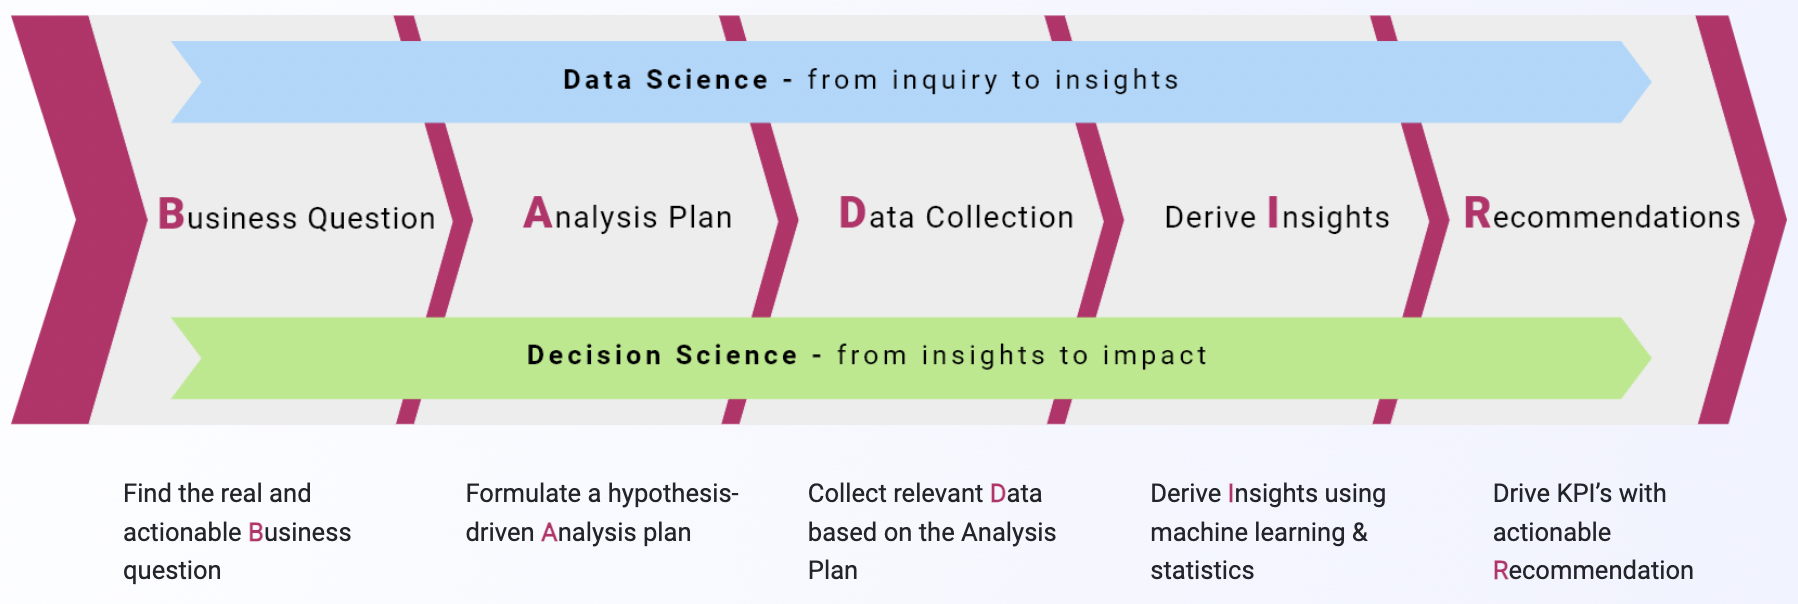
May
26

With all the talk about Big Data and Predictive Analytics – both of which involve complex, advanced skills and tools, driving millions of dollars in marketing – it is hard to believe in the power of simple analytics.

The truth, however, is that only 20-30% of the decisions really need the use of advanced techniques like predictive analytics.   Seventy to eighty percent of marketing decisions can be judiciously addressed with simple analytics techniques, which can be learned by any marketer and executed on an Excel spreadsheet.

80_20_Rule_of_AnalyticsConsider a breadth of industries: financial services, consumer goods, eCommerce  automobile, technology, media, and so on – a CMO broadly expects 3 key outcomes for his business:

  1. Bring more “future” customers to the door in the most cost-effective manner.
  2. Convert more of those who come to the door into customers.
  3. Keep the current customers “buying.”

In essence, he seeks a wide and targeted top of the funnel, and higher conversion at every stage to achieve maximum revenue at optimal ROI.  Data can support an optimized funnel through questions like: who and where to market; how much to spend on each channel; what drives response and conversion; who likes what message, what offer and what product; and what drives churn.  While this seems like a compelling case for Predictive Analytics, let me in contrast lay out a framework with better ROI using simple  analytics techniques to arrive at insightful and informed decisions for this CMO.

  1. Bring more “future” customers to the door in the most cost-effective manner by:
    1. Increasing marketable universe by identifying new channels based on existing customer profile. (Aggregate Analysis, Sizing/Estimation)
    2. Targeting messages and offers based on past marketing campaign to increase response.  (A/B testing, Correlation Analysis)
    3. Optimizing channels to Increase ROI and decrease cost of customer acquisition (Correlation Analysis)
  2. Convert more of those who come to the door into customers by:
    1. Identifying Conversion Drivers: Does certain fulfillment options, user experience, reviews options, cart options, payment options, offers and promotions drive incremental conversion? (A/B testing, Correlation Analysis)
  3. Keep the current customers “buying” by:
    1. Segmenting the base to drive engagement (simple segmentation based on past product usage or RFM or similar).
    2. Launching engagement campaign, customized by segments to drive “buying”
      1. Understand Engagement drivers (like certain offers, discounts, bundling, loyalty memberships etc) for each of the customer segments (Correlation Analysis)
      2. Campaign analysis – what resonates with customers and what doesn’t (A/B testing, Aggregate and Correlation Analysis)
      3. Understanding drivers of Churn – factors that make customers leave your business (Correlation Analysis)

Note that all of the above analytics techniques I would use initially are simple techniques that can be done in Excel and can be learned by any marketer. The success and efficacy of  these techniques would be powered by hypothesis driven planning, using a “Data to Decisions”™ framework like BADIR™. As the insights from the business mature, simple techniques may then in some cases point to a need or an opportunity to leverage advance techniques like predictive analytics.

Let’s say, an Ecommerce marketer uses the framework above and increases the cart conversion to 60% by identifying two major detractors to conversion, a redundant extra page in the flow and a bug in the cart using correlation analysis. That is a big win! But the cart conversion is still below that industry’s benchmark of 65%. From the analysis earlier, she finds that many additional independent attributes (like Google Checkout as primary payment option, page load time etc.) have an effect on conversion, but they are all individually insignificant and not worth the ROI for making the changes in the flow. Having established that, the marketer could then take the next step to engage with the Data Science/Analytics team to build an advanced conversion driver model that incorporates the effect of all of these independent attributes. This model can help identify the biggest factors that drive conversion and explain the 5% delta. Equipped with this information, the marketer can then work with the site engineering team to make the smallest/easiest/cheapest changes to the flow to get the biggest conversion impact. This is the perfect case for the use of advanced techniques. But this is typically only 20% of all use-cases, usually as a build up from simpler analysis!

Predictive Analytics are resource and time intensive – to the tune of 10-20x of simple analytics.  They need advanced skills and tools, historical data, operationalization, live validation, and constant maintenance and that is the reason for not using advanced skills to solve every business problem. A marketer, a product manager or an operations manager equipped with the right “Data to Decisions” framework and easy access to data can optimize 80% of their day-to-day workflow on their own, without having to rely on scarce and expensive analytics resources. For the 20% of decisions, where the potential ROI justifies the use of advanced techniques, they can work with their analytics counterpart. This is the picture of a well-functioning organization competing on analytics. In contrast, when organizations and their leaders are misled by Big Data and Predictive Analytics hype, they end up investing lopsidedly on advanced data analytics tools and resources, often resulting in poor ROI.

In summary, a smart CMO knows that a marketing team equipped with a “Data to Decisions” framework and easy access to data without the support of a data science team would fare much better than a marketing team with no data skills supported by a large data science team. Marketers have the advantage of having the deepest knowledge and experience about their product and their customers. That context, when married to data, is phenomenal. Without that context, even the best models would fail.

To learn more about BADIR (Aryng’s “Data to Decisions” framework) and the 5 Myths of Predictive Analytics, download the respective whitepapers here. If you are CMO, CEO/GM or CPO, ready to get your team equipped with the “Data to Decisions” framework, contact us for a free consultation on what your team may need. If you are ready to equip yourself with the “Data to Decisions” framework, start by taking our “Data to Decisions” intro analytics course online today! Once you have taken the level-1 course, you would get access to level-2, “Hands on Analytics” course and Level-3, “Hands-on A/B Testing” course online to complete your “Data to Decisions” skill upgrade.

Follow @AnalyticsQueen | Sign up for our Newsletter | http://www.aryng.com | Contact Aryng

Posted in Analytics Consulting, Analytics Methodology, Analytics Training, Big Data, Business Analytics, Predictive Analytics |
Leave a comment

Mar
28

McKinsey’s Big Data report lists shortage of talent in the big data space. Interestingly, the shortage of business professionals who can work with data (1.5M by 2018) is about 10X that of data scientists (140K by 2018). In my experience this shortage ratio exists even today. For every 10 business professional (product, marketing, operations folks), there is perhaps one or fewer data scientist (professionals with analytics or advance analytics skills).  So the way I see this gap being closed in the future would be that the business professional, would also be part analyst. Let me explain.

Analytics as a word conjures up images of complex algorithms and code; thereby most business professionals can’t imagine themselves as part analyst. But there is part of analytics that is simpler and more importantly, successfully used by business professionals today, in driving data based decisions. Let’s take a common decision almost all of us have experienced – buying a new car and let’s see how it can be approached analytically.iStock_000016134968XSmall

Analytical (data-driven) approach to purchasing a car: You start by nailing down your constraints – time, money etc. and your feature set – “must haves” and “good to have”. Perhaps good mileage is a “must have” for you and low emission is “good to have” for you. Based on all of these criteria (which is unique to you), you narrow down your choice to 3-4 cars as finalist. You test drive the finalists and choose the best one you like based on certain criteria that you had decided before. This is analytics. There is a process by which you came to the best and most appropriate choice of car based on your needs and facts. Analytics is fact driven decision making.

Non-analytical approach to purchasing a car: Non-analytical process would perhaps start by test driving cars, irrespective of any criteria, and you either discover the criteria as you go along rejecting cars to justify the rejections or buying the first car which “feels” right.

What is the advantage of analytical over non-analytical approach? I was recently talking to a friend who was complaining about the mileage of his new car,. He was very unhappy with $100/week spend on gas.  I asked him, if he had changed jobs, so his commute was longer than expected. He confirmed, it was not the case. I asked him, if the car is giving him lower mileage than expected. And that was also not the case. Finally I asked him, why he bought the car with low mileage when he knew he was going to use that for his long commute and when he knew cost was a constraint for him. He answered by saying, he didn’t know the cost would be this high, and that it would bother him and most importantly, he really liked the feel of the car when he drove it. Could he have gotten a car, which he liked the “feel” of while still making sure it met his “must haves”? You bet! But that requires the analytical approach to buying a car. Using data to drive decision gives you significantly higher chances of making good, long lasting decision over non data-driven approach.

Can most of us envision ourselves as using such kind of analytical approach to buying a car, or buying a house, or choosing a career, or choosing a school for our kids? Yes, most of us do. Is the process of making data-driven decision in our day-to-day “business” life a whole lot different?  No, it is not. Let me explain by taking an example.

Let’s say you are a marketing manager at an ecommerce company selling shoes (imagine iStock_000005223113XSmallZapatos).  Spring is here and for this quarter you have a marketing budget of $100K. You have 1M+ customers and prospects, and you have to decide where to spend that $100K to get the best ROI possible. Should you spend that towards acquisition i.e. driving new traffic to your site, or should you spend that towards engagement of current base or both? If you focus on acquisition, which channel or combination of channels should you choose? If you focus on engagement, should you go out to the entire base, or a subset? Should you customize your offering by segments and if so, how? At the end of the day, you want to make the choice which aligns the most with your company/ department’s priorities and gets you the best ROI. But the question is how to make the best choice NOW?

A non-analytical approach to marketing may look like doing what was done last spring (status quo) or choosing projects from last quarter or going with projects which you believe to be the best. Just like in the car buying example, unless you make a choice by keeping ROI (success criteria) in mind, you would likely not get the best ROI from your effort. You will execute some marketing campaign, probably not the best ones.

An analytical approach to this marketing campaign would be to learn from the past campaigns – what worked, what didn’t, what gave the best ROI. Let’s say, you find that your organic acquisition is at par with competition and you decide to invest in re-engagement of the current customer base, and habituation of the prospects or light users. Now, you would go back to past campaigns and see what worked. Let’s say, you find certain customer segments (loyalist) buy irrespective of marketing to them (you know it because you used a control in the last campaign) and you also find other segments that respond to marketing. Now you have clues as to which segment to not market, which segment to saturate towards optimizing the ROI.

Can you or any business professional do this? Yes, I think so. As long as you understand and practice a data-to-decisions framework like BADIR, you can use simple techniques to optimize your day to day decisions. These simple methods don’t need complex tools. As long as you have access to data through some data tool (like Tableau, Spotfire, Pentahoe, Splunk, Microstrategy, Business Object…), you can download the data into excel to analyze. You can also do the analysis in the data tool itself (if available).

Currently, business professionals may depend on their analytics counterpart to help make those decisions- analyze past campaign, find the best target segment etc., but those analytics resources are increasingly scarce. There by, many business professionals are finding themselves having to either learn how to optimize those decision using data or make decisions based on gut. And we know, gut based decisions don’t show long term results.  And I see this learning of analytical skills by business professional accelerating and becoming a core requirement in the future.  This is the way we will close the projected gap in the McKinsey report.

If you are a business professional – marketing manager, product manager, sales professional and operations manager; in a role where you are making decisions in a day to day workflow, then it is imperative that you equip yourself with the skills to apply statistics to gain business insights i.e analytics. Make sure you are not left behind.

Start your journey with Aryng, by taking the Level-1 class online today. Details at: http://www.aryng.com/Online-Analytics-Training/DTD102-Business-Impact-Through-Analytics.html. Once you have taken the level-1 course, you would receive details for monthly mentorship calls with me and other Aryng instructors. On the completion of level-1 training, you would also get details to enroll in Level-2 (Hands-on Business Analytics) and optional Level-3 (Hands-on Test and Learn)  online training, that would complete your skills upgrade education.

See you in the class!

Posted in Analytics Consulting, Analytics Methodology, Analytics Training, Business Analytics, Experimentation | Tags , , , , ,
Leave a comment

Mar
18

Are you an executive responsible for driving incremental revenue to the company and delivering incremental value to your stakeholders, but not very confident of the initiatives in place to achieve the 40% growth that  has been mandated by the board? Does your organization have tons of data but still you don’t understand the business drivers to achieve that 40% growth? Are you spending more than 10% of your marketing budget on Big Data but still not able to utilize it? Then it is time to turbo-charge your journey, and here is how.

Step 1- Introspection on your self and your leadership Team: Are you making growth_121908064evidence based decisions or are you gut-happy decision-maker? Are you holding your leadership team accountable to decisions they make? If the answer to either one of these is “No”, then it is time to make some significant changes to your leadership style. Data-driven journey begins with you, you are the catalyst and you are the engine. Your organization will not progress towards being data-driven, unless, you and your leadership team are asking the 3 key questions of your data and your team: (1) “How do we define our success?” (2) “What drives our success?” and (3) “Who are our customers, and how do we engage them?” Whether you use zero-sum budgeting or other ways to hold your leadership team accountable to the decisions they make, there needs to be some accountability structure, because you can only manage what you measure. And as soon as you start looking back at decisions which were made, you start finding ways to optimize those decisions. And inarguably, there is no better way to optimize decisions, than basing it on data and facts.

Step 2- Invest in analytics skills development:  A Study by Accenture published a year ago, found the top in-demand skill gap for US Workers as problem solving, analytical skills and managerial skills. 55% of the workers report to be under pressure to develop additional skills however only 21% are reported to have acquired it through company-provided formal training. The professionals in your organization who are making decisions in their day-to-day workflow need to know how to make use of data, to find insights, which can help them make smarter decisions. Should your marketing manager spend $A on campaign X or Campaign Y? Should they reach out to all or only a sub segment of the customers with this campaign? All of these kinds of questions would be better answered when the marketing manager knows how to leverage the customer dataBADIR they have.  So “data to decisions” skills need to be developed for professionals in your organization, not only on the data side but also on the business side. And yes, analytics when done right, is a structured process (BADIR is one such approach), is learnable by most business professionals and the analysis part is doable in MS Excel.

Step 3- Invest in data infrastructure: Many organizations put off the upfront investment of time and resources on their infrastructure and their analytics maturity suffers. If you want to truly gain competitive edge in the market by leveraging the power of data for decision making, then your data team has to collect and store data appropriately to enable easy and seamless access by business users. The truth is, if it is not easy, they won’t use it. Counter intuitively, the hardest part of realizing a decent data infrastructure is not the hardware or technology choice, but the design and architecture of your information system. If information architecture (Big Data or small) talent is not present in your organization, then it will serve you well to hire external consultants to design the information flow and then your internal team can execute against that. Having said that, there is also no need to go overboard and over invest in trying to collect all the data possible (Big Data). If you ask the “the 3 Key Questions” appropriately (as laid out earlier), it would help you see the gaps in your understanding of your business and highlight the kind of data you do need. And remember, as your business evolves, so would the data need. So setting up an instrumentation process is integral part of your data maturity.

Step 4- Set up “formal” decision-making process: And lastly, there needs to be a transparent decision making process, which everybody in the organization understands. What kinds of projects get funded? What are the criteria for choosing one project over another? Eventually, everybody in the organization should have a clear understanding of why they are working on whatever they are working on. What objective does this project aim to fulfill and how does it relate to the organization’s Big Rocks/ priorities? To that end, a monthly/quarterly planning and review process is very helpful and “The 3 Key Questions” framework again comes in handy to identify the top projects organization should invest in and the criteria for decision-making.

For more details about this journey towards a data-driven organization where you are able to get the ROI from your Big Data investment, download The Analytics Maturity whitepaper, with DIY survey to figure out where your organization is stuck. And if we can help you in that journey, feel free to contact us.

If you would like to transform your organization to be data-driven, I would like to invite you to come join me and other executives for this ½ day round table, “Data-driven Executive” held on April 5th in Santa Clara, California.

And instead of just asking questions of your team, provide them the tools so they know how to leverage data. They can learn the complete science of making smarter decision using data at Aryng’s Business Analytics  and Testing workshop week held on April 15-19 2012, in Santa Clara, California.

Follow @AnalyticsQueen | Sign up for our Newsletter | http://www.aryng.com | Contact Aryng

Posted in Analytics Consulting, Analytics Methodology, Big Data, Business Analytics |
Leave a comment

Mar
1

As discussed in my previous posts, understanding the consumer psyche and the irrationality of the human decision-making process is key to developing winning value propositions or product features to test in the market. Here is a discussion of 5 Key Behavioral Economics (BE) principles (among dozens) that all marketers should not only understand but internalize.

Power Of Free: Can reducing the price of two commodities by the exact same amount, completely reverse consumer preference of one over the other? Traditional economics says NO. But indeed it is possible.

A group of researchers offered participants of a study a choice between purchasing a Hershey’s Kisses chocolate for 1-cent ($0.01) or Lindt Lindor chocolate truffle for 15 cents ($0.15). The participants, recognizing this as a good deal since the price differential in a supermarket would be larger than 14 cents between the two options, overwhelmingly chose the latter. However, when the price of both was reduced by 1 cent, thus making Kisses free and the Lindt Lindor for $0.14, the preference completely reversed with an overwhelming majority choosing Kisses!

What happened here? Nothing had changed–consumers would still get the same amount of incremental joy (consuming an exotic truffle vs. a regular candy) to the same amount of incremental pain (spending $0.14 more). The preference should not have changed. So why did it? Well, our response to price reduction becomes very non-linear when the price reaches “free”. We just love the word “FREE”. It evokes unreasonably positive feelings in the brain. Just the sight of the word “free” releases large quantities of dopamine in our brain to make us feel happy, and we end up responding irrationally.

So how does this play out in the real world. We get inundated with “free” offers every day and may believe that this does not affect us. But consider two economically identical deals– one messaged as ‘buy 1 get 1 free’; the other messaged as a volume discount deal as ‘get 50% off if you buy two’. Which one are you more likely to respond to?

Dominated Alternatives: Can introducing a third decoy option make you more likely to choose the option, I secretly want you to choose?

Consider this scenario at the Economist. Potential customers were given two subscription offers shown below– essentially an ‘online only’ subscription for $56, and and ‘online + print’ subscription for $125.

A large majority of people chose the first option ($56), although the second option ($125)was preferable to the publishers. They then introduced a third decoy option, that they knew nobody would prefer–$125 for print only. As expected no one chose the third option, but something magical happened! An overwhelming majority now chose the second option ($125 for online+print)! The mere introduction of this third option, made option #2 look very attractive–you were getting online version for free now!

What happened here? Well, this goes back to the idea that consumers have a very poor understanding of what a commodity is truly worth. They had no idea what a print or online subscription of the Economist is truly worth in $ terms. The first scenario with two options they had nothing to compare either option to. But with the introduction of the third option, option #2 and #3 are comparable and #2 wins hands down (you are getting online version for free after all !) . Option #1 has no comparable so it gets left out.

This principle has been demonstrated successfully in many different scenarios. The most bizarre  according to me, is one of dating. Participants of this study were shown pictures of 3 individuals of the opposite sex and asked which one would they prefer to go out on a date with. Only, there were only two individuals in the pictures, the third was a digitally altered slightly inferior version of one of the two. So think of it as A, B, and inferior B (say B’). An overwhelming majority chose B in this scenario! The idea is the same–no comparable for A, so A gets left out; B and B’ look similar, B being more attractive. Hence B wins in a large majority of cases.

Next time you are evaluating vacation packages, or buying a home, pay attention to how different options are being positioned. These professionals have figured this stuff out through experience, even if they do not articulate it this way.

Irrational Value Assessment: Are you more likely to admire a $5 bottle of wine, if I lied to you and told you that it costs $45? Research says you are. Members of the Stanford Wine Club were invited to taste 5 bottles of wine and rate them based on their liking. Only, there were actually only 3 different wines in those bottles– two wines had two bottles each. Each bottle was marked only with the price tag and nothing else. Some of the same wines were marked at significantly different prices. For example, the $5 wine and the $45 wine were actually the same, the true cost being $5. There was a clear correlation between the rating of the wine and the price tag — more expensive wines got systematically higher ratings. So the $45 bottle of wine got a significantly higher rating than the $5 bottle, although they were the exact same wine!

In another experiment, the same group was asked to rate the same wines again. Only this time even the price tags were absent. The cheapest wine was ranked the highest in this case!

Now, before we start calling these wine-experts snobs, consider this. Prozac was tested against a placebo. Only, the placebo was sold at a higher price ($2.50 per pill) than Prozac ($2.00 per pill). Placebo outperformed Prozac!

Consider another experiment, where students were given a caffeine +  sugar rich drink that was supposed to improve their alertness and focus in the short term. Their task was to solve as many puzzles as they can. Half of the group was asked to pay the full price of the drink, an the other half was given a significant discount on the price. The group that got the discounted drink, solved 30% fewer puzzles! This result has been consistent in multiple such studies over time.

So what is going on here? Well, turns out that we inherently expect cheaper stuff to be inferior. This feeling runs so deep, and its effect so profound on our brain, that the cheaper stuff truly ends up having inferior performance. It becomes a self-fulfilling prophecy. So the folks from Stanford Wine Club, were not being snobs when they rated the ostensibly more expensive wines as tasting better. They truly did enjoy the wines with higher price tags more. This was demonstrated by the increased activity in the pre-frontal cortex of the brain, when the same experiment was done under an MRI machine. Consumers of Prozac, deep within, expected a poorer performance compared to the more expensive Placebo. This expectation and conviction was so strong that it did create inferior performance in the body.

Decision Paralysis: Can reducing the number of options available to consumers, actually increase sales? Turns out it can!

In a study to prove this point, researchers sat down in a supermarket with bottles of Jam on display. The expectation was some users would stop by, fewer would taste, and yet fewer would purchase. One group sat with 6 varieties on display, and the other with 24 varieties on display. While more people stopped by in case of the 24-jar display, the number that bought was 10-times less than the 6-jar scenario (3% vs. 30%).

Jars Frank Cooper's jamJars Frank Cooper’s jam (Photo credit: Wikipedia)

What is going on here? We thought more choice is what consumers want. Turns out, when faced with too many options, we are unable to evaluate them all, and end up deciding not to buy at all. This has been demonstrated in many different situations. In a company with a voluntary savings program, the participation in the program fell by 2% for every 10 mutual funds added to it.

At the heart of this finding, is our inability to process too much information. This concept is known as cognitive load, which incidentally does have a magic number — 7 (+/- 2). Consider the study where participants were told (falsely) that they were participating in a study on long-term memory. They were asked to memorize a number, walk down the hall, wait for sometime, and repeat the number from memory to a different researcher in a different room. Half the group was given a 2-digit number, and the other half was given a 7-digit number. But as the participants walked down the hallway, there were refreshments available with a choice of a decadent chocolate cake, or a cup of fresh fruit. This was the real test — exercising self control when you mind is occupied. The study found that a majority of participants in the 7-digit group chose the cake, while a majority in the 2-digit group chose fruit.

What is going on here? Turns out that the part of the brain that is occupied with memorizing irrelevant illogical information such as random digits, is the same (pre-frontal cortex) part that is charged with exercising self control. Remembering 7 digits is a tough task–it is approaching our cognitive limit. The brain is so preoccupied with trying to remember those numbers, that it literally does not have the ‘bandwidth’ to exercise self-control.

Attribute Priming: Can just talking to customers about a certain attribute of the product, make them desire that attribute more? Research says YES!

Consider the following study. Researchers approached customers planning to buy laptop computers at an electronics store. Half of them were asked about their memory needs, and the other half were asked about their processor-speed needs. This was not steering or leading by any stretch. Turns out, that the group that was asked about the memory needs ended up buying computers with higher memory, and those in the other group ended up buying computers with higher processor speeds. Just getting them to think about certain attributes of the product affected their decision in favor of that attribute.

In a different study, where people were in line to pick up either yogurt or fruit, half of them were asked how they felt about yogurt, and the other half were asked how they felt about fruit. Later it was found that just talking to them this way, greatly biased their decision about what to eat.

If you are a marketer, and want to learn how to design and run effective tests, I invite you to attend the complete course on Experimentation - Aryng’s hands-on Test and Learn, either just by itself April 18-19, or attend the complete course on Analytics and Testing from April 15-19, 2013 in Santa Clara, California.

Additionally, if you are interested in our approach to Analytics, feel free to download FREE Analytics whitepapers. And if we can help your organization in the journey towards being data-driven, feel free to contact us.

Follow @AnalyticsQueen | Sign up for our Newsletter | http://www.aryng.com | Contact Aryng | Mukul’s Profile

Posted in Analytics Consulting, Analytics Methodology, Article, Big Data, Business Analytics, Experimentation |
Leave a comment

Feb
25

I came across the word “Data Scientist” a few years ago when somebody (from the valley, of course) asked me, “So you are a data scientist”? And my immediate answer was, “No, I am not a scientist “. Although I had spent a decade already in the data space, driving business impact through analytics, I did not see myself as a scientist.

My answer today is not all that different. To me scientist does conjure up an image of fully antiseptic lab environment, white lab coats and pipettes. Marry data to that term, it still sounds very white lab coat-ish, definitely R&D bend but with graphs running on a big screen monitor. A few other data science leaders in the Silicon Valley, like Daniel from LinkedIn, have similar interpretations of the word data science.

But a word is a word is a word, what is the big deal? But there is a big deal in the middle of all this. I frequently keynote at Analytics conference and one of the things I hear a lot from the data scientist/analytics professionals is that, many of them are producing, a lot of, analytics insights using state of the art algorithms BUT nobody in the organization cares! This I have heard from Data scientist, spanning the breadth of apparently “data-driven” Fortune 1000 companies, including LinkedIn, Facebook, Visa, eBay, Apple, Oracle, SAP to name a few.

So what is going on? On one hand we see reports about the massive dearth of data scientist (Source: McKinsey’s Big Data report), on the other hand, the work they are doing is hardly being leveraged. Why?

BADIRThe reason is “The MISSING Green Track”. Let me explain. Although “analytics”, the word, conjures up the image of graph, data, numbers, complex algorithms, it is only part of the story.  When analytics is done right, “The Blue Track”, – the process of getting insights from the data, needs to happen in parallel with “the Green Track” – the process that drives decision-making and impact in the organization. The Green track is all about what one needs to do to bridge the gap to the business, to understand the business priories, to work within business constraints, to bring along the key stake holders, to make the right hand-shakes at the right time, so when one is ready with insights from the data, the stake holders are ready and poised to make decisions, take actions based on those insights thus driving impact through data.

Today, data scientist get well trained or perhaps over trained on the blue track but the green track often eludes them, mostly because it is not taught as a science in the universities. Nevertheless green track is a science and is completely learnable (check out Aryng’s Data-to-Decisions Week – a week for complete hands-on education on analytics and testing – with green and blue track). Unless an insights sees the light of the day by way of getting transformed into a decision, it is a complete waste of resources and time. So unless analytics drives business impact, it is not analytics, it is just statistics, it is just data science. So that brings me back to the word data-science, which by the way it sounds, sounds academic and all too blue track to me. To me, Data Science + Decision Science = Analytics

But again, a word is a word is a word. As long as both green track and blue track process is followed, data will lend itself to decisions – call it data science or call it analytics.

For more details on blue and green track, which is part of BADIR- the 5 step process from “data to decisions”, feel free to download this whitepapers on BADIR. And if we can help your organization in the journey towards being data-driven, with green track married to blue track, feel free to contact us.

If you are an executive frustrated with low ROI from your data investment, in spite of a large data science team, then I invite you to join us for this ½ day Data-Driven Executive Workshop on April 5th, 2013, in Santa Clara, CA. This workshop would guide you on what is analytics (and what is not analytics), how organizations such as yours leverage data as an asset, how to measure your organization’s analytics maturity and then how to transition your organization towards higher analytics maturity, such that all the decision makers in the organization, irrespective of where they sit, have the right tools to make smarter, data-driven decisions.

Follow @AnalyticsQueen | Sign up for our Newsletter | Contact Aryng

Posted in Analytics Consulting, Analytics Methodology, Analytics Training |
Leave a comment

Feb
19

You know your keynotes at conferences have a positive impact when they raise awareness. My keynotes raise awareness not just to the science that is analytics and its application, but also the need to achieve erudition at it. I know, because one of the most commonly asked post-keynote questions I get is – “I’m very interested in furthering my knowledge in Analytics. Given my background, could you suggest what kind of analytics training should I look for?”

The past few years, have borne witness to a boom in analytics education – be it an Analytics major in a multi-year Master’s Degree, Software tool training, Multi-day workshops or even concise online tutorials.  The multitude of offerings, while all relevant, make the task of selecting the appropriate program very arduous for professionals. Additionally, there is not enough clarity on pertinence, process and practice to answer the one key question –what is truly needed to succeed in analytics? 

If you have been looking to get trained in analytics and have also been wondering how to choose, I recommend following these 3 steps to find out what you need, based your own background and where you want to go.

STEP 1: Identify what you want to do

What current/future role are you going for: are you/do you want to be ananalyst/data scientist? Or are you a business professional, looking to leverage analytics in your day to day work flow?

STEP 2: Identify the skills gap you have based on what you want to do

As you can imagine, the skills needed for business professionals within Marketing, Product etc. functions to leverage data effectively is going to be somewhat different from that of a data scientist. Data scientists need deeper technical skills and skills to work effectively with business professionals. The 6 key analytics skills used by successful analyst/data scientist are:

  1. DTD framework: Understanding and hands-on experience of the basic “Data to Decisions” framework
  2. SQL skills: Ability to pull data from multiple sources and collate: experience in writing SQL queries and exposure to tools like TeradataOracle etc. Some understanding of Big Data tools using Hadoop is also helpful.
  3. Basic “applied” stat techniques: Hands-on experience with basic statistical techniques: Profiling, Correlation analysis, Trend analysis, Sizing/Estimation, Segmentation (RFM, product migration etc.)
  4. Working effectively with business side: Ability to work effectively with stakeholders by building alignment, effective communication and influencing
  5. Advanced “applied” stat techniques (hands-on): Hands-on comfort with advance techniques: Time Series, Predictive Analytics – Regression and Decision Tree, Segmentation (K-means clustering) and Text Analytics (optional)
  6. Stat Tools: Experience with one or more statistical tools like SAS, R, SPSS, Knime or others.

On the other hand, business professionals need easy access to data through some kind of tool like Business Object, Micro strategy etc., basic analysis skills and ability to work effectively with data scientists and analysts. The 4 key analytics skills needed by business professionals – product and marketing managers are:

  1. DTD framework: Understanding and hands-on experience of the basic “Data to Decisions” framework
  2. Basic “applied” stat techniques: Hands-on experience with basic statistical techniques: Profiling, Correlation analysis, Trend analysis, Sizing/Estimation, Basic Segmentation
  3. Working effectively with analysts: Ability to work effectively with Data Scientists/Analyst
  4. Advanced “applied” stat techniques (intro): High level understanding of advance techniques: Time Series, Predictive Analytics – Regression and Decision Tree, Segmentation

STEP 3: Based on skills gap you identified, choose the most appropriate training option

Given what you want to do, figure out the skills gap you have and fill out the chart below. Depending on the gaps, there 3 major options to get the analytics training you need:

Analytics Training Need ChartAnalytics Training Skills Chart

  1. Master’s degree in Analytics: Several universities including NCSU,NorthwesternLSU and many more are offering Master’s degree in Analytics often by combining courses from their Statistics, Computer Science andManagement department. In my experience, this program is most useful for individuals with no quantitative background but looking for future data scientist/analyst roles. These programs are fairly comprehensive but are as a result, time consuming and often not appropriate for working professionals. Some universities do offer online options making it more accessible.
  2. Semester courses at local universities: Most universities offer semester/quarterly courses from statistics and computer science department, often as part of continuing education program. These courses are most appropriate for data scientist/analyst/people with some quantitative background who are looking to pick up incremental skills for their current analytics role- for e.g. if are in an analytics role and you have never used R, you can take a semester course like “programming in R”.
  3. Professional Workshop: Many consulting companies like AryngEMC, and individual consultants like Abbott Analytics , Prediction Impact and others offer short analytics training most appropriate for working professionals. Depending on their area of focus, these short courses are most appropriate for business professionals looking to leverage data to make better decisions and analyst looking to pick incremental skills. The most valuable aspect of these courses are that these are courses geared towards business and often taught by analytics professionals who have seen analytics in action as applied to business. Downside of these courses are, they are not comprehensive and often don’t cover all the statistical concepts. But being short in duration, they are very accessible by most working professionals. Statistical tool companies, like SAS, SPSS etc. are good places to get the respective tool training. Few of the consulting companies offer introductory courses online making it even more accessible, but I recommend taking the hands-on courses face-to-face with other participants to make the learning experience real life and pertinent to your current business environment.

But in the end, do your own due diligence and be sure to match the gaps you have identified with the courses you choose to take.To learn more about courses I teach, check out Aryng’s analytics training philosophy or workshop schedule. You can also sign up for Aryng’s Introductory Analytics Workshop online or live on April 15th, 2013. This course is a good starting point for business professionals specially marketing and product managers looking to leverage analytics in their day to day decision making and for future/current analyst who would like to be more effective in driving decisions based on the insights they produce.

You can also learn more about fundamental approaches to analytics by downloading one of Aryng’s analytics whitepapers here.

Posted in Analytics Consulting, Analytics Methodology, Analytics Training, Analytics Trends, Business Analytics | Tags , , , , , , , , , ,
Leave a comment

Feb
15

The structure of analytics in large organizations can take many forms—from having a gazillion analytics micro-teams embedded in each function or BU, to completely centralized analytics at the corporate level. What is the right strategy? What should your organization do?

Well, in that respect, the title of this post is misleading. To centralize or not to centralize, is actually NOT the question. If you think of centralization on a scale going from ‘not at all’ to ‘fully centralized’, the real question is what is the right level for you?

To answer that question you must be aware of the pros and cons of moving one way or the other on that scale. Having been a part of multiple “re-orgs” and that have gone up and down on the scale, and having influenced some of those movements some of the time, I have some first hand insight into this.

So here are the top 5 key trade-offs when faced with organizational structure of analytics.

1. Consultant Mindset vs. Deep Personal Investment: God bless consultants, they often save the day! But one thing they cannot claim is deep emotional investment in the organization they are working for. This is what high degree of centralization does. Analysts are assigned to BU’s or functions based on prioritization of the project and resource constraints. Their mindset is like that of a consultant, where you work on a project, crunch the numbers, deliver the insights and you job is done… time to move on to the next one. With analytics embedded within the function, there can be full integration of analytics with the project right from its conception. The alignment of purpose this creates, produces very non-linear synergistic effects with respect to the value derived from analytics. This alignment/ownership, of course could be a problem by itself, which brings us to the next point.

2. Objectivity (or at least the perception of it): If the analytics team reports into the owner of the domain, and their rewards are aligned with the success of the projects being analyzed, the objectivity of the analysis could be in question. The analyst could potentially introduce a bias to make the project/initiative look better than it actually is. With analytics, credibility is everything. The perception of lack of objectivity could be devastating for the entire group/organization. If you believe that numbers cannot lie, you are either not in the field of analytics or are deluded. Read How To Lie With Statistics for starters.

3. Bureaucracy vs. Efficiency: Centralization brings bureaucracy; sometimes copious amounts of bureaucracy,  depending on who is the heading analytics. Everything needs to get into the pipeline, and get prioritized, and get resources allocated against it. There are protocols for communication, to ensure the Business Units are not side stepping the process (this seems like paranoia but I have experienced this first hand). It could suck the excitement out of a very creative job (I am talking about analytics of course), and turn analysts into full time project managers (God bless project managers, I have nothing against them either).

4. Redundancy vs. Effectiveness: With the “embedded” model, it is easy for different analytics teams to get redundant in their analyses and continually reinvent the proverbial wheel. Centralization dramatically reduces redundancy, thus making the analytics team more effective. There is more knowledge sharing, a better sense of community of like-minded people, and more flexibility in leveraging a wide range of skill sets among analysts. This improves the throughput by improving the utilization of resources, thus also making the team lean.

5. Silos vs. Big Picture: Small teams of analysts embedded within the BU end up working in silos. While they become experts in their own domain, they run the risk of losing the big picture. This can be detrimental not only to the quality and relevance of the insights generated, but also to the career growth prospects and job satisfaction of the members of analytics team.

So that brings us the decision point—what is the right level of centralization. Business Units or functional teams will always resist centralization of analytics because they would not get dedicated capacity anymore. Analysts, on the other hand, would likely (but not always) resist decentralization. The holy grail is to find the level at which both the stakeholders are equally happy (or equally unhappy!), such that analysts get some opportunity to move around, cross-train and gain breadth of domain, and at the same time, have the chance to develop deep domain knowledge in a specific part of the organization and to influence/drive the strategy for the Business Unit as opposed to reporting out data. Finding that sweet spot is not easy, but this hopefully gives you a sense of what you are looking for in the first place.

For more details about how we approach analytics and how analytics can drive business impact, download analytics whitepapers from here. And if we can help your organization in the journey towards being data-driven, feel free tocontact us.

If you are an executive, tired of making decisions without facts – which often is the best you can do, but perhaps keeps you up at night, then here is the good news. It is possible to transform your organization that you do not have to fly blind anymore. The transformation begins with this ½ day Data-Driven Executive Workshop on April 5th, 2013, in Santa Clara, California.

Posted in Analytics Consulting, Analytics Methodology, Analytics Training, Big Data, Business Analytics, Uncategorized | Tags , , , , , , , , ,
Leave a comment

Jan
4

Instead, have an introspective look at your organization, and ask yourself – “Why are we not seeing the ROI from our analytics investment?” I bet this is what you will see:

  1. The multi-million dollar investment in the shiny, new BI infrastructure (Big data and all..) is not delivering to its expectations, leaving you pondering – “Where are the promised insights? Wasn’t this initiative supposed to reveal the knobs, that once turned would put a glowing Vegas slot machine to shame?”
  2. Your management is fully convinced that the analysts are not adding any value. Different reports show different numbers and half the time in meetings is spent in reconciling numbers (ouch!). People are having a hard time believing any number, let alone make decisions based on them. And decision making is back to where it has belonged – the gut!
  3. Your product and marketing managers are complaining that their analytics requests are not getting the priority they warrant, leaving them with no choice but to make decisions blindfolded. Your analysts have shown them how they can easily access and manipulate the data directly from this new BI cube. Some PM’s and marketing managers are getting a hang of the tool, and are now able to drag and drop columns to create the right view. But they are still not entirely sure what exactly the data in the view is telling them.
    1. Turns out, your analysts have been working their asses off, what with being constantly bombarded with one mission critical data request after another. Prioritization? Non-existent! Everything is afire, and the analysts have the proverbial hose! Most of their time is spent on taking orders from everyone and putting out one fire after the other.

    If this is you and your organization, know that you are not alone. Many organizations find themselves struggling with establishing and achieving an optimal analytics strategy and framework, or in other words, analytics maturity. And no, firing the firefighter is never the best way to put out and prevent fires.

    The solution lies in determining what went wrong, and what needs to be corrected. By understanding how a fully oiled analytics machine works, you would be able to see where you are in the process and what you need to do to get there. Please refer to my Analytics Maturity blog post for details.

    In a nutshell, there are 4 major detractors to analytics success in an organization:

    Top 4 Detractors to Analytics ROI

    1. 35% of the time, it is the missing analytics skills – For analysts – how well are they able to bridge the gap to business, to understand the real question behind the ask before they jump into the data pull? For PM’s and marketing managers – how well do they understand the recipe behind making decisions based on data (BADIR framework), how well familiar they are with the fundamental analytics technique?
    2. 10% of the time, it is the missing decision making process – How does budget get allocated? What is the process of laying out product roadmap?
    3. 25% of the time, it is the organization’s data maturity – how easy is to get to data, how many version of the truth exist, does data exist in its rawest form for everybody to aggregate as they please?
    4. 30% of the time, it the management and leadership – how is the management making decision, how are they establishing roles and responsibility, how are they holding people accountable?

    For more details, download The Analytics Maturity whitepaper, with DIY survey to figure out where your organization is stuck. And if we can help you in that journey, feel free to contact us.

    And instead of firing the analyst or the product managers, have them learn and hone analytics techniques and the decision making process at Aryng’s DTD week – Hands-on Analytics and Testing workshop on April 15-19 2013, in Santa Clara, California.

Posted in Analytics Consulting, Analytics Methodology, Analytics Training, Big Data, Business Analytics | Tags , , , , , , , , , , , ,
Leave a comment

Mar
5

In this short post, I want to share 3 tips for executives, who want to run their organization leveraging the power of data.

Tip #1: Start from the top: Don’t throw bunch of data scientist on a dataset and expect them to find insights. That is akin to looking for gold in Pacific Ocean by swimming around. Instead, start by defining the key questions, that once answered uncovers the lever that you can turn to move your company forward.

Tip #2: Tools don’t have the “answer”: Irrespective of whatever the best analytics tool vendors promise, no data or analytics tool has the answer. It is the talent (business professionals as well as analytics professionals), who, when they understand the business question and follow a structured hypothesis driven approach to analytics, find amazing insights to drive impact in the organization.

Tip #3: Analytics isn’t the sole prerogative of the data science team: In truly data-driven organizations, business professionals as well as analysts know how to drive fact-based decisions. In that sense, every decision maker in the organization is part analyst. Check out our 1-week Data-to-Decisions Intensive for Product and Marketing Managers.

Want to learn more about how to turn your organization into a data-driven organization: Sign up for this 3-hour Data-driven executive workshop, April 5th, Santa Clara, California.

_____________________________________________________________

Upcoming Workshops

April 5th: Data-Driven Executive
Are you an executive, wanting to compete on analytics?thmb_101_handbook

  • Is your team trained to make the best decisions leveraging data?
  • Do you think your customer conversion is as optimized as it can be?
  • Do you feel like you/your team is asking the right questions of your data?
  • Do you know, if your team is working on the right product feature?
  • Is your team able to launch successful test with conclusive results to optimize ROI?
  • Do you feel like you are maximizing traffic on your website?

If you answered “No” to one or more of the questions, above, join us for this half-day workshop where we share with you what is Analytics and Big data beyond the buzz, how to compete on analytics, case studies from leading data-driven organization and understanding your own organizations’s Analytics Maturity and the biggest gaps.
Click here for details

April 15th – 19th: Learn Analytics and Testing hands-on
Are you a Product or Marketing Manager or a BI/Analytics professional supporting product or marketing function? DTD-102-Certificate-img

  •  Do you have tons of questions about your customer and products, how your customers use your product, what drives their engagement?
  • Do you have to make decisions without much insights because 80% of your analytics request doesn’t get prioritized?

Learn all you need to know about how to derive insights from data and how to drive decisions using insights at this  1-week Data-to-Decisions Intensive, April 15-19th.


Posted in Uncategorized |
Leave a comment

Aug
28

As published on Forbes

Data, Data everywhere, not a drop to act! Every organization is collecting data today, but very few know what to do with it. Part of the challenge is, organizations don’t know what to ask of data? Where to begin? They have made multi-million $ investments in instrumentation and collecting BIG data through hadoop-cluster, spitting out billions of rows and thousands of columns, but now what? Where to go next?

For a while, people thought, “now that I have the data, it would tell me the answer”. But soon they realized, data doesn’t speak, it only responds.

So the onus comes back to the users (those who want to leverage data for making smarter decisions) to ask the “right” questions. But what questions to ask?

Whether you are a CEO of a $15Million dollar online apparel shop or IT manager of web servers at a health industry giant like Kaiser Permanente or a marketing manager at a large bank like Wells Fargo, the key questions remain the same. They are:


  1. How am I doing? For the CEO of the apparel business, it means, how is the apparel business doing and for the marketing manager, it means, how is his/her department doing? There are many ways to answer this question including laying out a financial measurement framework, balanced score card or something in between. But the most important part is to understand and agree companywide on the KPI or set of KPIs (Key Performance Indicator) for your business. Is it revenue that you are optimizing or margins? Is it penetration or NPS (Net Promoter Score) or some integrated index?
  2. What drives my business? Once you have a KPI identified, you need to understand what drives that KPI. Some of this can be derived mathematically, some could be mere hypothesis that need to be validated. For example, number of visitors and conversion are important drivers of revenue for the apparel business. On the other hand, for a gaming company, with a fremium model, and less than 1% paying customers, total number of players is not a driver of revenue but number of players on a certain game might be. What’s important here to understand the dynamics of your specific business through portfolio analysis.
  3. Who are my customers, what are their needs? Customer is central to all of our businesses. And we know all of our customers are not alike. Some are more sophisticated, heavy user of our product; others have used our product only once. For the apparel business, there might be two macro customer segments, those who would buy product wholesale to retail in their own boutiques and those who are buying for personal use. Their needs from the ecommerce site and the company would be different. Companies who understand their customers and customize their offering, messaging, marketing channel accordingly, delight their customers, securing their future revenue (or KPI). And that is ultimately, what we all want to do, to drive our KPI in the right direction.

Granted, most of the high level executives in an organization do keep an eye on the KPIs and can quickly sum up the company financials, but do they know what drives those KPIs? Additionally, do the folks further down in the organization know what they are working towards and why? Can they make a good decision of which project to prioritize over others i.e. what will drive their KPI the most? KPIs are the results we want, but unless we can identify the right levers to pull to move those KPI, we are flying blind. It is the answer to these three questions that can help identify the critical business levers to manage the business by.

The process of unraveling and understanding of your own business or department is an iterative one. The process begins by asking these 3 questions at the highest level and then iteratively asking hundreds of cascading questions to get deeper breakthrough insights needed to maximize the ROI. And in order to truly incorporate this data-driven process of running the business, all individuals in the organization; be it the marketing professional, product manager, sales professional, financial analyst or business analyst, need to know how to start asking the right questions of the data, to optimize their own KPI’s.

So before you make another cent of investment in your servers or infrastructure (to capture more data), or fund another marketing campaign or product enhancement, answer these three questions to the extent possible with current data set and identify what other data and insights you need to understand the levers you can pull to make a difference.

For more details, download this 3-Key Question whitepaper, with DIY examples of how to start answering these questions on your business and finally putting your data to work. And if we can help you in that journey, feel free to contact us.

To learn more about peeling your own “business” onion by asking the 3-key questions, attend our upcoming 1-day Business Impact through Analytics Workshop on September 28 2012, in Santa Clara, CA.

Posted in Analytics Consulting, Analytics Training, Analytics Trends, Big Data, Business Analytics, Stategies | Tags , , , , , , ,
Leave a comment